gold bullion, dinar, dirham, gold, silver, jewellery

Saturday, April 30, 2011

Why GOLD is the biggest opportunity in your life time!!!!! don't wait.

The Last Stage of Gold Bull Market: Mania 
Every major gold bull market in modern history has exhibited the same three basic stages:
1. Currency Deflation Stage
2. Investment Demand Stage
3. Mania Stage 
The result:
A gradual, constant rise in gold prices at the beginning...
Followed by a sudden and dramatic spike towards the end.
Take a look at the 1970s gold bull market chart below, as an example of this phenomenon:
091010goldrush
So far in today's gold bull market, we've seen the first two stages...
During the first stage of a gold bull market, gold prices go up because the value of the dollar goes down.
We've already experienced this very phenomenon over the last nine years — in the form of a 33% drop of the US Dollar Index between the summer of 2001 and spring of 2011.


In the second stage, gold prices continue to grow due to increased investment demandSeeking to protect their wealth by getting rid of devaluating dollars, and attracted by the modest gains of the first stage of the gold bull market...
Investors start to load up on gold, which further snowballs the price of higher still.
This is already happening.
959quote1a
With the introduction of the popular gold ETFs and other securities, investment demand has had incredible strength since the beginning of this gold bull market, growing in terms of both tonnage and dollar value.
And it continues to increase steadily...
091010worlddemand
Again, the first and second stages of a gold bull market generally return considerable gains.
Gold prices in this bull market, in fact, have increased as much as 449%.
But it's the third and final stage of a gold bull market that can turn everyday investors into instant millionaires.

Stage Three: MANIA

During the third stage of a bull market, full-on buying mania turns the gradual ascent into a sudden explosion.
To see how something like this might look today, here's what the 1970s pattern I showed you up above looks like when applied to the modern gold market:


A sudden spike in demand, the beginning symptoms of which we're already starting to see today, could multiply gold prices by 100, 200, 300, as much as 400% from today's levels in the next 30 months.
And this isn't just me making these observations.
No matter where you look, experts in this field tend to agree...
959quote2a
959quote3a
quote_2
Now, if you think that these predictions are shocking...
Or that the theory is controversial...
You couldn't be more wrong.
In fact, because it's always been a hedge against inflation, and a universally-accepted method of storing wealth...
Gold prices have followed one of the most predictable patterns known to economics.
So what happened in the 1970s, while dramatic, wasn't unusual or even surprising.
And it's exactly the same set of circumstances we're looking at today.
Devaluation of currency... increased investor demand...
Only this time around, there's one factor we have to consider that wasn't even on the horizon back during the last gold boom of 30 years ago.
And this factor is big and powerful enough to turn this into the biggest bull market in history.
China's Gold Fever
 You hear about this raging economic powerhouse almost everyday in the news...
But what most people don't know is that despite all their cash, despite their vast manufacturing capacity...
The Chinese lack the single asset that they need to provide stability to their economy, confidence to their regime, and ultimately, achieve parity with the West.
They lack the single asset that governments have depended on for centuries to ride out recessions and cushion the effects of years of inflation on reserve currencies...
The Chinese lack gold.
Just look at this table to see what I mean:
World Official Gold Holdings: December 2009
091010chinaholdings
Compared to the established Asian, European, and North American economies, China sorely lacks in the one area that may be most important to them in the coming years.
Looking closely at their foreign reserves, you'll see that they would have to multiply their gold holdings by a factor of 45 just to catch up to the United States.
And as you read this, that's exactly what they're doing.
China is working overtime to even out the gap separating them from the world's old-guard economic leaders.
952_quote3

And it's not just giant government-operated financial institutions that have flooded into this newly opened market...
The biggest single segment of buyers may prove to come from the emerging pool of China's private investors.
You see, Chinese families save between 30% and 40% of their annual earnings (on average).
That's up to eight times the rate at which their American counterparts save.
And yet — up until now — the Chinese domestic gold markets still lagged behind the United States and Europe by a factor of five.
gold_gap2
But just like their respective banking institutions, these individual investors are rapidly closing the "gold gap."
Since last year, domestic demand for net gold investments in China has increased by121%.
952_chinachart
According to UBS, the world's second largest manager of private wealth assets:
"The international gold market is now paying a lot more attention to China's gold demand, not just from an official reserve asset perspective, but also private demand..."    
                            
      All this activity from two of the world's second biggest economy has contributed to recent rises in gold prices.
      The real explosion in gold value, however, is yet to come... And mostly likely, it will be of a magnitude never seen before.
      Just think about this:
      If China's domestic gold consumption were to match U.S. levels, the world would have to produce an extra 12.4 million ounces of gold.
      That's more than China itself  — the world's single biggest producer — turns out in a year.
      And considering that world gold production has dropped 8 out of the past 10 years, producing an extra 12 million ounces of gold per year to meet the demand will prove difficult, if not impossible.
      Such a milestone would push prices higher than ever.
      So, no matter who you listen to...
      The conclusion is almost always the same:
      It's highly unlikely that you'll be looking at a bull market like this one ever again in your lifetime.
                   will the history repeat itself?
                             better be prepare

      Friday, April 29, 2011

      When is the Best Time to Buy Gold?

      I bet you don’t own enough gold. 

      Before you tell me I’m wrong, let me ask it this way...

      •    If inflation returns, or even hyperinflation... 
      •   If the economic crisis persists and gets worse... 
      •   If uncertainty and fear continue, and chaos and rioting  

          begin... 
      •   If stock markets languish or suffer another meltdown... 
      •   If the recovery spending of the world’s governments 

          proves futile...  
      •   If government interference in the economy continues 

          to increase... 
      •   If the value of the U.S. dollar takes a major fall... 
      •   If world recovery from the current 

          recession/depression takes years... 
      •   If you’re still wondering whether you have enough 

         “safe” money... 

      ...would you feel you own enough gold? 


      If all those things come to pass, I suspect many of us, including myself, would wish we had a few extra gold coins or bars stashed away. 

      So let’s assume you answered “No” to my question and need to add some ounces to your collection... is now a good time to buy?

      The Best Time to Buy Gold?


      Before glancing at the chart below, if you had to pick the month with the weakest average gold price, which would you select?


      In our current 8-year bull market, June has seen the lowest return for gold. In other words, it’s been, on average, one of the best times to buy. 

      How does this compare to the bull market of the 1970s? 


      In the last great bull market, summer also was a good time to buy gold (although April was even better.) 

      What about gold stocks?


      Since 2001, July and October have been the weakest months for gold stocks, as measured by the AMEX Gold Bugs Index, and the best times to buy. 

      However, keep in mind that these are price tendencies and not certainties. There were Junes when gold was up, and some Julys when gold stocks were up. Meaning, avoid using this chart for trading purposes or in anticipation of an immediate gain. Instead, use it to prepare for possible gold price weakness ahead. And if the weakness shows up, treat it as a buying opportunity and add to your holdings to position yourself for the next leg up in the bull market. Consider that this summer could be the last chance to buy gold for three figures.

      Don’t lose sight of where we are at this point in the recession – in an intermission in the bad economic news. When it becomes apparent that the good ole days aren’t coming back, sentiment – and markets – could move rapidly. And gold is one of the best forms of capital that can protect you in a financial Armageddon. That gold was up in 2008 is a reminder of its protective power. 

      How much gold should you have? Continue to accumulate physical gold until you can honestly say you don’t care how many dollars Ben Bernanke prints.  

      source:http://www.caseyresearch.com/articles/when-best-time-buy-gold

      Thursday, April 28, 2011

      Silver Pops; Gold Hit another record

      Silver Pops; Gold Hits Record on Inflation Worries

      Gold for June delivery was jumping $10.20 to $1,527.30 an ounce at the Comex division of the New York Mercantile Exchange. The gold price soared to a record intra-day level of $1,535.10 an ounce while the spot gold price was less aggressive rising $1.10, according to Kitco's gold index.

      Silver prices were soaring $2.30 to $48.26 an ounce, just slightly shy of their intra-day high of $49.82. The U.S. dollar index was sinking 0.12% to $73.23.
      Thursday's rally was carry over from Wednesday, when gold and silver popped 1% and 2%, respectively and rose even higher in after-hours trading. Federal Reserve chairman, Ben Bernanke, can be thanked for the rally. The unanimous decision by the Fed to keep interest rates at 0-0.25% until at least the fall as well as keeping its balance sheet the same size after quantitative easing ends in June meant more cheap money for longer.
      The Fed will reinvest its profits from its current $600 billion bond buying program back into the market not adding extra cash but not taking any away either. Inflation forecasts were also below the Fed's 2% target, which means the central bank would want more inflation. Some experts are calling this QE 2.5 and say that this leaves the door open to a third round of quantitative easing, or QE3.
      This is "adding quite a bit of pressure to the dollar index and investors are going to be searching for those hard assets to protect themselves," says Phil Streible, senior market strategist at Lind-Waldock. "[I am looking] at the long side of both [gold and silver]." Streible would be buying if gold sunk to $1,505-$1,510 level and if silver breaks south of $46.
      Streible says the rally was even stronger because speculators who were washed out in the recent selloff could get back into the market as well as those who missed the rally the first time. His forecast for 2011 is $1,650 for gold and $60 for silver.

      It's not just the U.S. The bank of Japan left interest rates unchanged at its latest central bank policy meeting and lowered growth forecasts estimating a recession. On the flip side, the IMF has said that Asia needs to tighten more and faster to fight rising inflation. This balancing act escalates the likelihood of negative real interest rates, at least for the medium-term.
      "The prospect of low interest rates and higher inflation expectations in the U.S., coupled with ongoing issues such as increasing Eurozone debt concern and [Middle East-North Africa] unrest continue to create a bullish environment for bullion as investors look to hedge against negative real-interest rates and rising inflation," says James Moore, research analyst at FastMarkets.com.
      Monday on the Comex, trading of silver futures popped to a record 319,204 contracts. Adding to potential volatility is the end of April, where traders must either roll over their existing contracts or let them expire. This could also account for the price discrepancy between the futures market and spot (physical) market.The recent rally doesn't make gold and silver any less crowded, however, meaning that there are a lot more people in the market who could sell or take profits, especially in silver.
      In the latest commitment of traders report for the week ending April 19th, gold speculative longs rose 5%, while short contracts were down 0.5%. Silver, however, was a different story, with long positions up 4.3% and shorts up 7%, pointing to fiercer rallies in silver but also more volatility.

      Where next for GOLD and SILVER?

      Gordon Pape

      FORBES CANADA REPORT

      PERSONAL FINANCE

      A London Good Delivery bar, the standard for t...
      Image via Wikipedia
      Gold closed on April 27 at an all-time high of $1,517.10 an ounce. But despite all the buzz about bullion recently, that represents an increase of only 6.8 per cent from the 2010 year-end price of $1,420.78.
      Silver finished at $45.96 an ounce. That’s not an all-time high – silver hit US$55 an ounce in 1980 when the Hunt brothers tried to corner the market. But it’s a huge jump of 49.6 per cent from the price of $30.72 that prevailed as we entered this year. Gold may have the glamor but silver has the momentum right now.
      The dilemma for investors is how high can precious metals prices go from here? How high the moon?
      There are two diametrically opposing views on this. One is that gold and silver are in a classic bubble phase and that both are overdue for a major price correction. The other is that with inflation on the rise, there is a lot of upside potential remaining for both. The real answer may be somewhere in between.
      It’s important to remember that although gold and silver are often viewed in tandem, the forces that drive their spot prices are actually quite different. Silver is primarily an industrial metal, with about 60 per cent of consumption used in the manufacture of a wide range of products.
      A report released in March by the Washington D.C.-based Silver Institute, a non-profit international association of miners, refiners, wholesalers, and manufacturers, focuses specifically on the industrial side of the silver business. Prepared by GFMS Ltd., a highly respected London-based precious metals consultancy firm, the report says that 47 million ounces of silver were used by the photo voltaic industry in 2010, 36 million ounces by the automotive sector, 22 million ounces in the production of computers, and 13 million ounces in cell phones.
      Silver is also used in a variety of products that may surprise readers including face creams, washing machines, flat screen TV sets, water purification, food packaging, and, believe it or not, socks. GFMS believes that overall industrial demand will increase by 180 million ounces between now and 2015 at which time it will reach 665.9 million ounces.
      You would logically conclude from this that the price of silver will continue to rise. That’s true in the short term says GFMS, which predicts prices will remain high through 2012 with the average for 2011 “comfortably eclipsing the 1980 record high” in nominal terms (but not inflation-adjusted terms). But once this run is over, prices will start to drift lower “in reflection of less robust investment in the silver market”. The report also notes that as the metal becomes more expensive, manufacturers will look for cheaper alternatives.
      Investors should pay close attention to this report, which is the most comprehensive and analytical study I could find on the prospects for silver. The implication is that there is still more upside in the metal, and the shares of the companies that produce it, but don’t overplay the hand. Within 18 months or so, this party will be over.
      Gold consumption follows a very different pattern. GFMS released its annual gold survey on April 13 and it showed that 52 per cent of existing above-ground gold is held in the form of jewelery, 19 per cent by private investors, 16 per cent by central banks, 11 per cent in “other fabrications”, and 2 per cent “lost and unaccounted”. So unlike silver, gold is used mainly as a store of value and for decorative purposes.
      The report predicts that gold production will increase by 6 per cent this year compared to only 0.4 per cent in 2010, which would normally have a depressing effect on the price. However, demand will be strong, especially from investors and governments, due to rising inflation expectations and the on-going sovereign debt crisis in Europe which, says GFMS, will eventually spread to the U.S. and Japan (this report came out before Standard & Poor’s downgraded the U.S. debt rating). The result “will further undermine faith in government paper,” says GFMS.
      Looking ahead, the report warns that we could see a retracement in the gold price to the high $1,300s range in the next three months, which will bring out the bargain hunters. After that, investors will drive bullion prices higher “with a breach of $1,600 in the second half still a strong possibility”. (Coincidentally, that is the price I set as my 2011 target in my January predictions.)
      This forecast may help to explain why gold stocks have been laggards this year, despite the rise of bullion to a record high. As of the close of trading on April 27, the S&P/TSX Global Gold Index was down 4 per cent year-to-date. Many precious metals funds are in a loss position year-to-date, especially those that are heavily weighted to gold.
      If GFMS is correct, expect the prices of gold stocks and funds to drift lower over the summer. Use that as an opportunity to add to your positions so that you will be able to profit from the rebound that should begin in August or September.
      Of course, international events could change this outlook. However, based on what we know right now, silver looks like a strong buy while gold is a hold/buy on weakness.
      source:http://blogs.forbes.com/gordonpape/2011/04/27/where-next-for-gold-and-silver/

      Silver is not yet in bubble. Here's why....

      This essay will attempt to address the question of whether or not silver prices are in a bubble, or possibly may be turning into a bubble and if so what trading strategies may be suited to the situation. This article will hopefully provide another string to the readers bow in attempting to identify bubbles and being able to protect one’s portfolio and even potentially profit from them. For the record we feel it is prudent to state our view upfront, we do not think silver is in a bubble at this point in time. However we think that it is likely that it will become a bubble in the future, but we cannot say when or at what price?
      Asset price bubbles have occurred since the beginning of financial markets and will continue to do so as long as there remains a marketplace for assets to be traded. A key property of a bubble is that is it near impossible to identify with certainty before it pops, but once it does pop the bubble is apparently obvious to everyone. In our opinion, only those who risk capital and profit betting against a bubble can claim to have correctly identified one.
      A casual glance at the chart could leave an impression that history is going to repeat itself and silver prices are about to crash. However in order to not only successfully indentify bubbles but also profit from them, one will need to know the tipping point. This is the point at which the bubble is unsustainable and begins to breakdown.
      There are many factors which contribute to the emergence of bubbles and one would need to look at a myriad of factors to determine when a bubble may pop. We will focus on just one in this article, momentum. In finance, momentum is the empirically observed tendency for rising asset prices to continue to rise. We are attempting to gauge when silver may run out of momentum and when this bull market will turn into a bubble and ultimately pop.
      Whilst some may consider it crude to study momentum as opposed to fundamentals such as supply and demand, we feel that it is vitally important from both a psychological and technical standpoint. Psychologically if investors are used to silver prices increasing 30% per year and then silver prices only increase at a rate of say 15% for one year, psychologically this return looks poor on a relative basis, even though it is still positive and normally would leave many investors satisfied. Therefore there is a greater incentive to sell silver since it is not performing as well as it was in the past. Technically once a bubble is fully underway prices begin to rise in a parabolic or exponential fashion. If the price ceases to rise in an exponential fashion, selling will commence, even if the price is still rising, since investors will have extrapolated the exponential rise and so anything short of parabolic will not meet their expectations.
      The most recent example of this was in the housing bubble. Prices didn’t actually have to fall at all to trigger a crash, all they had to do was plateau or rise sluggishly and this would spark selling by people who had bet on prices continuing to rise. Without continually rising prices real estate investors could not refinance and borrow more against their properties to buy additional properties or other assets, so the buying stopped and the selling began. This was when the bubble popped; this was the tipping point before the actual crash that many investors strive to identify.
      So how does this relate to silver? Although we believe that silver does indeed have strong fundamentals, we do think it is likely that the metal will become drastically overvalued in the future as a result of speculative buying by the masses. In an attempt to measure the momentum behind silver and when this momentum will run out, we have analyzed the rate of silver prices increases over the last 50 years or so, since 1968.
      The chart below shows the rolling 100 day percentage change in the silver price. This is not a perfect measure of momentum, but it’s a start.
      As you can see, during the blow off in 1980, silver prices were increasing at a rate of roughly 400% per 100 trading days. This compares with a current rate of increase of approximately 73% per 100 trading days. So if you think silver’s current rally is going at a nose bleed pace, in the 1980 blow of silver prices were increasing 5.47 times faster than they are at the moment.
      So far it appears that the rate of increase in silver prices at present is still below the relative rate of increase in 1980, therefore implying there is further upside. However this analysis doesn’t take into account that the Bunker-Hunt brothers were attempting to corner the market for physical silver in the late 70s, a buying force which is not present today. Therefore one should err on the side of caution when using this barometer for trading purposes as it may not reach 1980 levels. But at present the barometer isn’t even close, so we do not think silver is in bubble at the moment.
      The chart below best shows how silver is far from in a bubble yet. We have smoothed the 100 day percentage change and overlaid the nominal silver price.
      As shown by the blue line still being relatively low in contrast with 1980, there is still a great deal of upside potential for not only the silver price itself, but the rate at which silver prices are increasing. When both the blue and red lines are parabolic, then a bubble argument can be made.

      source:http://www.kitco.com/ind/Kirtley_Sam/apr262011.html

      Advantages of silver over gold

      Advantages of Silver Over Gold
      The average person can’t afford to buy gold, so it is most suitable for wealthy people for investment and central banks.
      With silver being so much cheaper, the average person can go to his local coin dealer and buy some.
      The advantages of silver over gold as an inflation hedge are numerous and need to be considered:
      1. The silver market is much smaller, and it doesn’t take as much money moving into silver as an investment to move the market up. Silver has outperformed gold dramatically over the last few years, going from $3 an ounce to over $40 an ounce.
      2. Silver is also a very important industrial metal with over 3,000 industrial uses.
      3. The government has never seized silver, although they have seized gold. If that worries you (it doesn’t worry me much), you would feel safer with silver rather than gold.
      4. The government actually has no stockpile of silver to unload. There is now more gold above ground than silver because of the silver industrial usage.
      5. I look upon silver as money. Throughout history more silver has been used more for money than gold. Historically, silver coins became the common denominator for money in more places and more times than gold.
      If you are wealthy and can afford to buy some gold, be my guest. I think you will do just fine. However, silver will outperform gold about three to one. When I receive income from my business, I set aside enough cash to take care of my normal business affairs because paper money is still a means of exchange, although it is no longer a store of value. As a means of exchange, you can conduct your normal affairs. If I have any left over, I go to my local coin dealer and buy silver.
      What kind of silver should you buy?
      There are American silver eagles, junk silver, and foreign silver coins that can be bought from any coin dealer, and they are also easy to sell. The price fluctuates not only daily, but hourly. So there is always a place you could sell it.
      But why would you want to sell it if the government is still inflating the currency? Hang on to your silver.
      How far will silver go? Darned if I know; that’s above my pay grade. All I know is that we are in a bull market, and we ain’t seen nothin yet.
      I don’t expect it to retreat. When I buy silver, I am just buying another form of money that I believe will prevail over paper.
      Where will you keep it? Any place that thieves won’t be able to find it or get to it. Concealment is probably the best strategy. I wouldn’t keep it in my bank safe-deposit box, just in case the government decided to change its position on silver. Right now, silver is just treated as another commodity.
      The government is even manufacturing and selling silver coins. But they have no stockpile, so they have to buy on the open market just like you do.
      There are more people in the world who can afford to buy some silver than can afford to buy gold; thus, smaller volume will move the market up and up, and up.
      Who cares about that? I don’t care if it goes up. I won’t sell it any time soon. This bull market will not end until the world changes its attitudes towards paper money. There is no sign of that.
      Some day you might want to give it to your children or build your estate for them to inherit it. They will thank you and call your name blessed.
      By Howard Ruff
      The Ruff Times

      Tuesday, April 26, 2011

      Understanding why gold will keep going UP

      Last week I had the pleasure of participating in a webcast for Bloomberg Markets Magazineregarding gold investing. It was a very insightful presentation and I suggest you view the replay atwww.bloombergmarkets.com. What struck me on the call was the negativity surrounding the gold market. Call it a bubble, a frenzy or mania, there seems to be a large number of voices in the marketplace who just are not fans of gold, whether prices are moving up, down or sideways.
      Naysayers started calling gold a bubble back when prices hit $250 an ounce and though gold’s bull market has tossed and flung the bubble callers around for almost a decade now, their voices have only gotten increasingly louder as prices broke through $1,000, $1,200 and now $1,400 an ounce.
      However, gold prices appear asymptomatic of the signs generally associated with financial bubbles.
      For instance, we haven’t seen price spikes. Despite rising from under $1,000 an ounce to over $1,420 over the past six months, that represents only a 0.7 standard deviation move for gold prices, according to Credit Suisse (CS). The average standard deviation move of other bubbles—Japanese equities in 1986, the tech boom in 1999, the GSCI in 2005 and gold in 1979—is 5.3. Gold’s 180 percent move in 1979 represented a 10.3 standard deviation move, more than 14 times the magnitude we see today.
      The reality is that gold doesn’t possess the traits necessary for a financial bubble to form. Rodney Sullivan, co-editor of the CFA Digest, has done some great research on the history of markets and bubbles going all the way back to the 1600s. He discovered three key patterns in the 47 major financial bubbles that occurred over that time period.
      These three ingredients of asset bubbles are financial innovation, investor exuberance and speculative leverage. The process begins with financial innovation, which initially benefits society as a whole. In the exuberance stage, usage of these innovations broadens; they become mainstream and attract speculation. The third step, the tipping point for a bubble to form, is when these speculators pile on massive leverage hoping to achieve greater success. This excessive leverage adds increased complexity, which mixes with irrational exuberance to create an imbalance in the marketplace. Eventually, the party comes to an end and the bubble bursts.
      This is what happened with the housing bubble in the U.S. as Main Street home buyers leveraged themselves 100-to-1, Fannie Mae leveraged itself 80-to-1 and Wall Street investment firms leveraged themselves over 30-to-1.
      Gold as an asset class is far from being overbought by speculators. Eric Sprott recently did a fascinating presentation explaining how underowned gold is as an asset class. Sprott wrote that despite a 30 percent increase in gold holdings during 2010, gold ownership as a percentage of global financial assets has only risen to 0.7 percent. That’s a big increase from the 0.2 percent level in 2002, but Sprott points out that it’s misleading because the majority of that increase was fueled by gold appreciation, not increased level of investment.
      Sprott estimates that the actual amount of new investment into gold since 2000 is about $250 billion. Compare that to the roughly $98 trillion of new capital that flowed into other financial assets over the same time period.
      Gold equities have seen even lower levels of investment. From 2000 to 2010, $2.5 trillion flowed into U.S. mutual funds, but only $12 billion of that went into precious metal equity funds. Of course, those figures were significantly impacted by the advent of gold ETFs during the decade. Despite the growth of the SPDR Gold Trust (GLD), which held more 1,200 tons of gold as of March 31, gold remains largely underowned as a portion of global financial assets.
      The bar chart from CPM Group shows gold as a percentage of global financial assets over time. In 1968, gold represented nearly 5 percent of financial assets. In 1980, the level had fallen below 3 percent. That figure had shrunk to less than 1 percent by 1990 and has remained there since. Sprott wrote that “it is surprising to note how trivial gold ownership is when compared to the size of global financial assets.”
      Gold as a percent of global financial assets
      That point is magnified by the pie chart from Casey Research. Dr. Marc Faber included it in his April newsletter to show just how small a portion gold and gold stocks are for large institutional investors like pension funds.
      Percentage of gold holdings in a typical pension fund in minimal
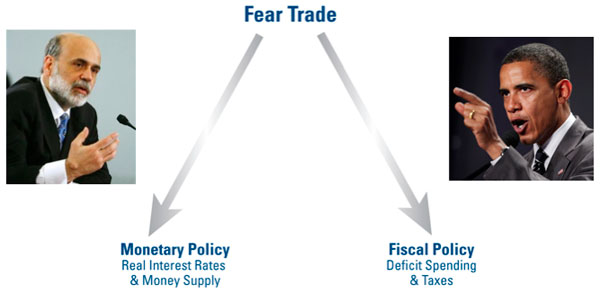
Investors who don’t think gold is a bubble but fear they’ve missed the boat need to look at the short- and long-term factors supporting gold at these historically high price levels. In the near-term, gold prices are being buoyed by continued weakness in the U.S. dollar.
      The Trade-Weighted Dollar Index (DXY) is just above the lows experienced during November 2009 and is only 8 percent above the “critical” March 2008 low, according to BCA Research. BCA says the U.S. dollar’s weakness is driven by four factors:
      • Federal Reserve balance sheet expansion via QE2
      • Combination of low real interest rates, steeply upward-sloped yield curve and perky inflation expectations that should continue in the U.S.
      • Plans by the European Central Bank to raise rates later this month
      • Willingness of Chinese authorities to allow for yuan (RMB) appreciation when the U.S. dollar is weak
      This is part of what we call the Fear Trade. This graphic illustrates that the Fear Trade is a function of two separate government policies: monetary and fiscal. Whenever there is a structural imbalance between a country’s monetary and fiscal policies, gold tends to perform as a “safe haven” currency. Currently, the quantitative easing measures implemented by the Federal Reserve and the significant size of the deficit spending by the government to increase entitlements to ward off a recession have created a significant imbalance between monetary and fiscal policies. This has devalued the U.S. dollar which, in turn, has boosted gold prices.
      Fear Trade
      We believe that as long as the U.S. government refuses to trim entitlement and welfare programs and continues to keep Treasury bill yields below the inflation rate to battle deflation, gold will remain an attractive asset class.
      Longer-term, our experience shows that whenever you have increased deficit spending, rapid money supply growth and negative real interest rates—that’s when the inflation rate is higher than the nominal interest rate—gold tends to perform well in that country’s currency. So far we have not seen rapid money supply growth here in the U.S., but the other two factors have been the main thrust behind gold’s record rise.
      GFMS CEO Paul Walker echoed those drivers in an interview with MineWeb this week. Walker said that “ultra-low interest rates, macro-economic dislocation, fears of global imbalances…the wrath of these things still remain solidly in place and that’s really the bedrock of the gold bull rally.”
      CS says the combined $6.3 trillion of excess leverage in the G4 economies (U.S., eurozone, Japan and Great Britain) means that their central banks will be forced to push real interest rates down to abnormally low levels. You can see from the chart that this is quite bullish for gold prices. Any time the real Fed funds rate is below 2 percent, gold tends to rise.
      Gold prices tend to rise when real short-term interest rates are below 2%
      Current projections from the Congressional Budget Office (CBO) have the U.S. federal deficit at $1.5 trillion this year. To show the effect this has had on gold prices, we overlaid the rise in U.S. federal debt with the price of gold.
      U.S. Federal Debt vs. Gold
      You can see from the chart that gold’s bull run began in 2002, about the same time federal debt began to rise significantly. Gold played catch up at first, but the two have tracked each other rather closely. Since 2002, gold prices have risen 308 percent versus a 119 percent increase in federal debt. This means that gold’s sensitivity to a rise in federal debt is just over 2-to-1. With lawmakers in Washington, D.C. still squabbling over where and by how much to cut the budget, it’s unlikely the federal debt level will recede any time soon.
      This is very constructive for long-term gold prices, but just how bullish depends on who you ask. The team at CS sees gold at $1,550 per ounce by year end. BCA estimates gold to remain in the $1,400-$1,600 range in 2011. Walker of GFMS said he believes gold will surpass the $1,500 mark by year end because “all of the structural factors supporting gold are in place.” Perhaps the most bullish forecast has come from Rob McEwen, former gold analyst and founder of GoldCorp, who said late last year, and reiterated last week, that he thinks gold could hit $5,000 per ounce in the next three to four years.
      E-7, G-7 Money Supply
      It’s important to remember the strong cultural attraction that many people in emerging countries have toward gold. It’s a much stronger connection than that of the developed world and essential for rising gold demand.
      We like to compare the G-7 countries to our E-7—the world’s seven most populous nations. Interestingly, the G-7 is 50 percent of global GDP but only 10 percent of the total global population. The E-7, on the other hand, represents roughly 50 percent of global population but only 18 percent of global GDP. We would like to point out that money supply and GDP per capita is rising substantially faster in the E-7 than it is in the G-7, 17.7 percent money supply growth in the E-7 versus 3.7 percent in the G-7. If money supply growth in the E-7 continues at a rate of 15 percent or more for the E-7, it would be a strong catalyst for higher gold prices.
      In conclusion, based on the above factors and trends, we believe gold could double over the next five years.

      Don't worry about pullback..opportunity to buy instead..looking ahead :)

      The article below comes courtesy of Frank Holmes, CEO and Chief Investment Officer of U.S. Global Investors.
      The S&P credit agency sent shockwaves through the global financial system on Monday when it issued a warning on U.S. debt and changed its outlook on the U.S. sovereign credit rating from “stable” to “negative.” This sent markets lower and the prices of commodities such as oil rocketing back above $110 per barrel and both gold and silver to new highs.
      It should be clear the S&P announcement was just a warning, not a lowering of the U.S. debt rating, which was affirmed at AAA (the highest level possible). The fears quickly subsided and U.S. markets hit fresh three-year highs. Essentially there’s only a one-third chance of a downgrade and anyone who’s ever listened to the weather man knows that a 33 percent chance of rain means you probably don’t need your umbrella.
      However, the warning validates what we already know: The U.S. needs a plan to address its debt and budget issues…and fast. Due to the fact that future fiscal austerity measures will likely act as a drag on the economy, we also think this opens the door for a third round of quantitative easing (QE3) heading into next year so we’ll have to keep an eye on Bernanke and the Federal Reserve’s next move.
      These factors will likely produce downward pressure on the U.S. dollar and upward pressure on commodity prices. This is why we emphatically believe the bull cycle for gold still has a long way to run. (Read: The Bedrock of the Gold Bull Rally).
      One of the things we recently pointed out was the effect money supply growth can have on gold. Last week, one of my fellow presenters at the Denver Gold Group’s European Gold Forum was Dr. Martin Murenbeeld from Dundee Wealth who put the notion of a “gold bubble” in context with the following chart.
      If you compare the current bull cycle for gold against gold’s run from the 1970s and 1980s, you can see that today’s run has been slow and steady. It’s also missing the sharp spikes typical of a bubble.
      Also, a key difference in this gradual move higher is the growing affluence of the developing world. There people have traditionally turned to gold as a store of wealth and we are seeing that in unprecedented numbers in countries such as China and India.
      Dr. Murenbeeld also presented this fascinating chart showing how much gold would need to increase in order to cover the amount of money that has been printed since gold was revalued at $35 in 1934.
      Using that as the cover ratio, gold would need to climb all the way to $3,675 an ounce to cover all paper currency and coins. If you use a broader—and more common—measure of money (M2), gold would need to rise all the way to $7,931 in order to cover the outstanding amount of U.S. money supply.
      With gold pushing through the $1,500 level and silver above $46, many investors are questioning whether we’ll see a pullback. Going back over the past ten years of data, you can see that gold’s current move over the past 60 trading days is within its normal band of volatility, up about 7 percent over that time period.
      Silver, however, has traveled into extreme territory. Over the past 60 trading days, silver prices have jumped over 58 percent and now register nearly a 4 standard deviation move on our rolling oscillators (see chart). Based on mean reversion principles, odds favor a correction in silver prices over the next few months.
      We should be clear: If a correction occurs, this would not mean the rally is over. It would just be a healthy bull market correction and reflect the normal volatility inherent with these types of investments. Investors must anticipate this volatility before participating in these markets.
      This volatility also brings along opportunity. We believe we’re only halfway through a 20-year bull cycle for commodities and investors can use these pullbacks as an opportunity to “back up the truck” and load up for the long-haul.