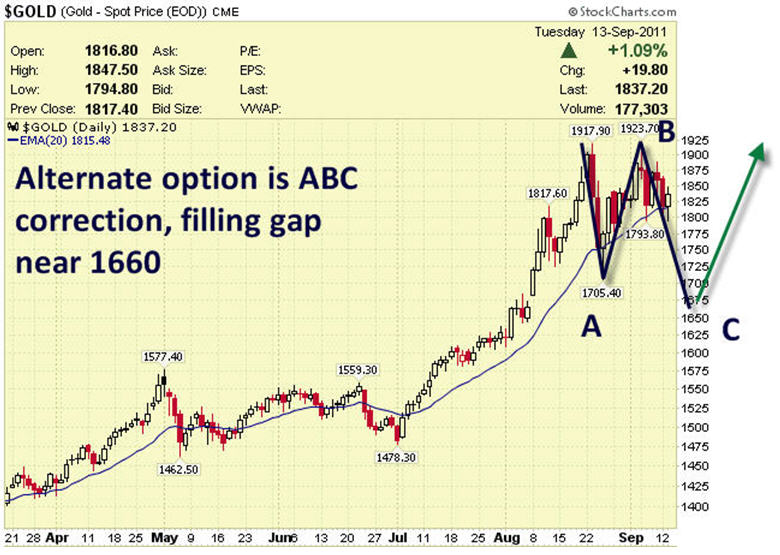
My most recent update was to simply try to figure out whether the continuing correction in Gold would take the form of an ABC pattern or an ABCDE Triangle Pattern. It is becoming more clear that the official pattern is ABC. In English it means that the first leg down from 1910 to 1702 was the “A” Wave, the rally back up to 1920 was the “B” wave. The C wave is continuing underway and one of my longstanding targets is $1643, which is a Fibonacci fractal relationship to the prior lows and highs, and also conveniently fills in a “Gap” in the Gold chart in the 1650’s.
During these 4th wave consolidation periods, it reduces sentiment back down to normal levels and lets the economics of the move in Gold catch up with the price action that was extended. The first area to watch is the re-test of $1702 spot pricing for a C wave low, but the evidence is for a further drop to $1643 before I would get too interested in trying to game Gold to the upside.
Here is the chart I sent out 9 days ago with Gold at $1837 forecasting a possible C wave continuing lower
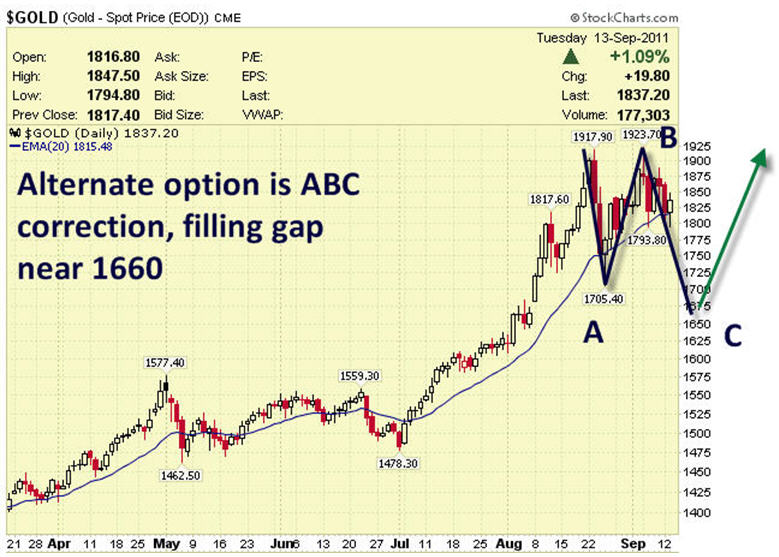
I’ve stayed away from either shorting Gold or going long gold while I watch and confirm the 4th wave pattern. It’s simply the smart way to go knowing that upside will be difficult to obtain and downside risks are high. It does now appear that I am eliminating the Triangle pattern and sticking with the ABC Correction with the C wave still working its way lower. If $1702 breaks, then you should expect to see 1620-1643 as next pivot low ranges.
If you would like to be kept abreast of intermediate Gold pattern forecasts, (As well as SP 500 and Silver) take a look at www.markettrendforecast.com today and get a 33% coupon discount to subscribe good for 24 hours. Or, you can sign up for the occasional free reports as well. Dave Banister
CIO-Founder
Active Trading Partners, LLC
www.ActiveTradingPartners.com
TheMarketTrendForecast.com
Dave Banister is the Chief Investment Strategist and commentator for ActiveTradingPartners.com. David has written numerous market forecast articles on various sites (MarketOracle.co.uk, 321Gold.com, Gold-Eagle.com, TheStreet.Com etc. ) that have proven to be extremely accurate at major junctures.
© 2010 Copyright Dave Banister- All Rights Reserved
No comments:
Post a Comment